| 
1/27/05
What has the 85% rule done to performance?
We
got a letter from reader Dave Smithers who said, "You
hear complaints from time to time from fans who are
disappointed with the 85% nitro rule. But, it seems
to me that we are actually seeing more good runs
with a lot less tire smoking since the inception
of the 85% rule. I wonder if anyone has any records
on the number of good runs before and after the 85%
rule?"
Well, we wondered too. So, we queried our resident
stat-man, Jim Hawkins, who put together some info and
graphs on percentages of good runs in eliminations
and percentages of good side by side eliminations. |
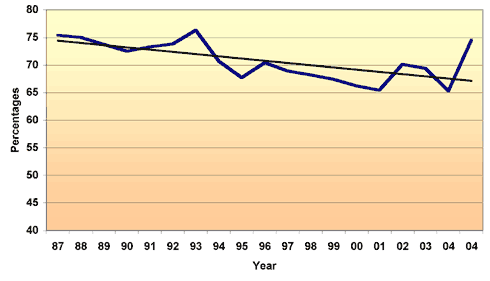
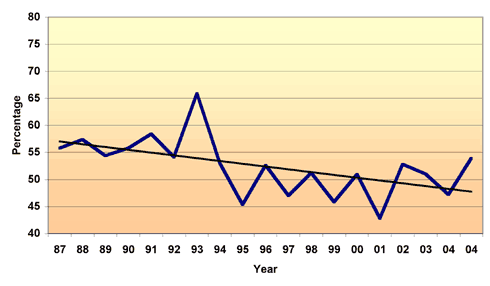
The blue line on the charts is the actual data and the dark
line is the trend. Both charts show that since 1987, fewer
fuel cars go down track under full power and there are less "both
good" side by side eliminations. In 1987 the average
amount of full power Top Fuel runs was around 75% and now
the average is around 68%. What does that mean? If there
are 7% fewer full-power runs and you saw every race in 2004,
you saw around 48 fewer full-power runs: 690 total elimination
runs X 7% = 48.3.
Chart # 1 TF - Percent of all cars going down the track
during eliminations under full power.

Chart # 2 TF - Percent
of side by side elimination
runs that both cars are under
full power.


|
